14.08.2023
Acid - basic indicators. Indicators Color of indicators in different environments
Indicators- organic compounds that can change color in solution when the acidity (pH) changes. Indicators are widely used in titrations in analytical chemistry and biochemistry. Their advantage is low cost, speed and clarity of research.
Indicators are usually used by adding a few drops of an aqueous or alcoholic solution, or a little powder, to a sample of the solution being tested. So, during titration, an indicator is added to an aliquot of the test solution, and color changes at the equivalence point are observed.
Indicator color transition intervals
The figure shows approximate data on the existence of different colored forms of indicators in aqueous solutions.
For more detailed information (multiple transitions, numerical pH value), see the next section.
Table of pH transition values for the most common indicators
Acid-base indicators common in laboratory practice are given in order of increasing pH values that cause color changes. Roman numerals in square brackets correspond to the color transition number (for indicators with several transition points).
| Indicator and transition number | X | Color more acidic form | pH interval and transition number | Color more alkaline form |
||
|---|---|---|---|---|---|---|
| Methyl violet | yellow | 0.13-0.5 [I] | green | |||
| Cresol red [I] | red | 0.2-1.8 [I] | yellow | |||
| Methyl violet | green | 1,0-1,5 | blue | |||
| Thymol blue [I] | To | red | 1.2-2.8 [I] | yellow | ||
| Tropeolin 00 | o | red | 1,3-3,2 | yellow | ||
| Methyl violet | blue | 2,0-3,0 | violet | |||
| (Di)methyl yellow | o | red | 3,0-4,0 | yellow | ||
| Bromophenol blue | To | yellow | 3,0-4,6 | blue-violet | ||
| Congo red | red | 3,0-5,2 | blue | |||
| Methyl orange | o | red | 3,1-(4,0)4,4 | (orange-)yellow | ||
| Bromocresol green | To | yellow | 3,8-5,4 | blue | ||
| Bromocresol blue | yellow | 3,8-5,4 | blue | |||
| Lakmoid | To | red | 4,0-6,4 | blue | ||
| Methyl red | o | red | 4,2(4,4)-6,2(6,3) | yellow | ||
| Chlorophenols red | To | yellow | 5,0-6,6 | red | ||
| Litmus (azolithmine) | red | 5,0-8,0 (4,5-8,3) | blue | |||
| Bromocresol purple | To | yellow | 5,2-6,8(6,7) | bright red | ||
| Bromothymol blue | To | yellow | 6,0-7,6 | blue | ||
| Neutral red | o | red | 6,8-8,0 | amber yellow | ||
| Phenol red | O | yellow | 6,8-(8,0)8,4 | bright red | ||
| Cresol red | To | yellow | 7,0(7,2)-8,8 | Dark red | ||
| α-Naphtholphthalein | To | yellow-pink | 7,3-8,7 | blue | ||
| Thymol blue | To | yellow | 8,0-9,6 | blue | ||
| Phenolphthalein [I] | To | colorless | 8.2-10.0 [I] | raspberry red | ||
| Thymolphthalein | To | colorless | 9,3(9,4)-10,5(10,6) | blue | ||
| Alizarin yellow LJ | To | pale lemon yellow | 10,1-12,0 | brown-yellow | ||
| Nile blue | blue | 10,1-11,1 | red | |||
| Diazo violet | yellow | 10,1-12,0 | violet | |||
| Indigo carmine | blue | 11,6-14,0 | yellow | |||
| Epsilon Blue | orange | 11,6-13,0 | dark purple | |||
Substances that change color when the reaction of the environment changes are indicators - most often complex organic compounds - weak acids or weak bases. Schematically, the composition of indicators can be expressed by the formulas HInd or IndOH, where Ind is a complex organic anion or indicator cation.
In practice, indicators have been used for a long time, but the first attempt to explain their action was made in 1894 by Ostwald, who created the so-called ionic theory. According to this theory, undissociated indicator molecules and its Ind ions have different colors in solution, and the color of the solution changes depending on the dissociation equilibrium position of the indicator. For example, phenolphthalein (an acid indicator) has colorless molecules and crimson anions; methyl orange (main indicator) – yellow molecules and red cations.
phenolphthalein methyl orange
HIndH + + Ind – IndOH  Ind + + OH –
colorless Malinov yellow red
A change in accordance with Le Chatelier's principle leads to a shift in equilibrium to the right or left.
According to the chromophore theory (Hanch), which appeared later, the change in color of indicators is associated with a reversible rearrangement of atoms in the molecule of an organic compound. This reversible rearrangement is called tautomerism in organic chemistry. If, as a result of a tautomeric change in structure, special groups called chromophores appear in the molecule of an organic compound, then the organic substance acquires color. Chromophores are groups of atoms that contain one or more multiple bonds that cause selective absorption of electromagnetic vibrations in the UV region. Groups of atoms and bonds, such as −N=N−, =C=S, −N=O, quinoid structures, etc., can act as chromophore groups.
When a tautomeric transformation leads to a change in the structure of the chromophore, the color changes; if, after rearrangement, the molecule no longer contains a chromophore, the color will disappear.
Modern ideas are based on the ionic-chromophoric theory, according to which a change in the color of indicators is caused by a transition from an ionic form to a molecular one, and vice versa, accompanied by a change in the structure of the indicators. Thus, the same indicator can exist in two forms with different molecular structures, and these forms can transform into one another, and equilibrium is established between them in solution.
As an example, we can consider structural changes in the molecules of typical acid-base indicators - phenolphthalein and methyl orange under the influence of solutions of alkalis and acids (at different pH values).
The reaction, as a result of which, due to a tautomeric rearrangement of the structure of the phenolphthalein molecule, a chromophore group appears in it, causing the appearance of color, proceeds according to the following equation:

colorless colorless colorless

crimson
Indicators, like weak electrolytes, have small dissociation constants. For example, the K d of phenolphthalein is 2∙10 -10 and in neutral media it is found predominantly in the form of its molecules due to the very low concentration of ions, which is why it remains colorless. When alkali is added, the H + ions of phenolphthalein bind, “pull together” with the OH – ions of the alkali, forming water molecules, and the dissociation equilibrium position of the indicator shifts to the right – towards an increase in the concentration of Ind – ions. In an alkaline environment, a disodium salt is formed, which has a quinoid structure, which causes the color of the indicator. The shift in equilibrium between tautomeric forms occurs gradually. Therefore, the color of the indicator does not change immediately, but passes through a mixed color to the color of the anions. When an acid is added to the same solution simultaneously with the neutralization of the alkali - at a sufficient concentration of H + ions - the dissociation equilibrium position of the indicator shifts to the left, towards molarization, and the solution becomes discolored again.
The color of methyl orange changes in a similar way: neutral molecules of methyl orange give the solution a yellow color, which, as a result of protonation, turns into red, corresponding to the quinoid structure. This transition is observed in the pH range 4.4–3.1:

yellow Red
Thus, the color of indicators depends on the pH environment. The color intensity of such indicators is quite high and clearly visible even with the introduction of a small amount of an indicator that cannot significantly affect the pH of the solution.
The solution containing the indicator continuously changes its color as the pH changes. The human eye, however, is not very sensitive to such changes. The range over which a change in the color of the indicator is observed is determined by the physiological limits of color perception by the human eye. With normal vision, the eye is able to distinguish the presence of one color in its mixture with another color only if there is at least a certain threshold density of the first color: a change in the color of the indicator is perceived only in the area where there is a 5-10-fold excess of one form relative to the other. Taking HInd as an example and characterizing the equilibrium state
Hind  H + + Ind –
corresponding constant
 ,
,
we can write that the indicator exhibits its purely acidic color, usually detected by the observer, when
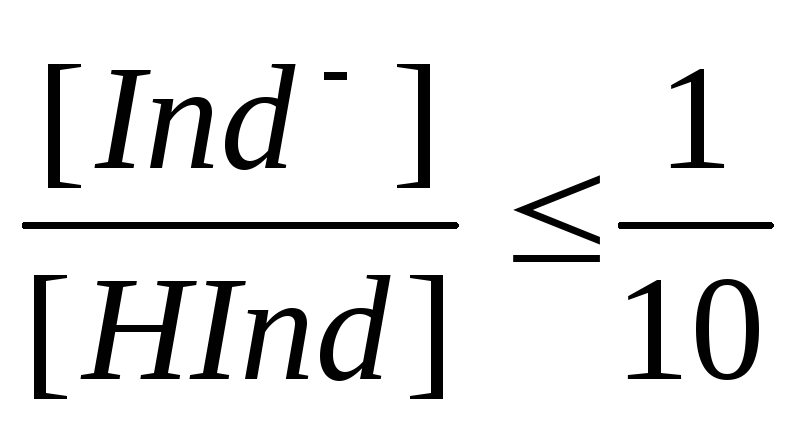 ,
,
and purely alkaline coloring at
Within the interval defined by these values, a mixed color of the indicator appears.
Thus, the observer's eye distinguishes a change in color only when the reaction of the medium changes in the range of about 2 pH units. For example, for phenolphthalein this pH range is from 8.2 to 10.5: at pH = 8.2 the eye observes the beginning of the appearance of a pink color, which increasingly intensifies to pH = 10.5, and at pH = 10.5 an intensification of the red color no longer noticeable. This range of pH values, in which the eye distinguishes a change in the color of the indicator, is called the indicator color transition interval. For methyl orange, KD = 1.65·10 -4 and pK = 3.8. This means that at pH = 3.8, the neutral and dissociated forms are in equilibrium in approximately equal concentrations.
The indicated pH range of approximately 2 units for different indicators does not fall in the same region of the pH scale, since its position depends on the specific value of the dissociation constant of each indicator: the stronger the acid HInd, the more acidic the transition interval of the indicator is in the region . In table 18 shows the transition intervals and colors of the most common acid-base indicators.
To more accurately determine the pH value of solutions, use a complex mixture of several indicators applied to filter paper (the so-called “Universal Colthoff indicator”). A strip of indicator paper is dipped into the test solution, placed on a white, waterproof substrate, and the color of the strip is quickly compared with a reference pH scale.
Table 18.
Transition intervals and coloring in different media
most common acid-base indicators
|
Name |
Indicator color in different environments |
||
|
Phenolphthalein |
colorless |
crimson 8.0 < pH < 9.8 |
crimson |
|
violet 5 < рН < 8 | |||
|
Methyl orange |
orange | ||
|
3.1< рН < 4.4 | |||
|
Methyl violet |
violet | ||
|
Bromocresol | |||
|
Bromothymol | |||
|
Thymol |
2,5 < pH < 7,9 | ||
INDICATORS(from Latin indicator - pointer) - substances that allow you to monitor the composition of the environment or the progress of a chemical reaction. Some of the most common are acid-base indicators, which change color depending on the acidity of the solution. This happens because in an acidic and alkaline environment the indicator molecules have different structures. An example is the common indicator phenolphthalein, which was previously also used as a laxative under the name purgen. In an acidic environment, this compound is in the form of undissociated molecules, and the solution is colorless, and in an alkaline environment, it is in the form of singly charged anions, and the solution has a crimson color ( cm. ELECTROLYTIC DISSOCIATION. ELECTROLYTES). However, in a highly alkaline environment, phenolphthalein becomes discolored again! This occurs due to the formation of another colorless form of the indicator - in the form of a triply charged anion. Finally, in concentrated sulfuric acid, a red color appears again, although not as intense. Its culprit is the phenolphthalein cation. This little-known fact can lead to errors in determining the reaction of the environment.
Acid-base indicators are very diverse; many of them are easily accessible and therefore have been known for centuries. These are decoctions or extracts of colored flowers, berries and fruits. Thus, a decoction of iris, pansies, tulips, blueberries, blackberries, raspberries, black currants, red cabbage, beets and other plants turns red in an acidic environment and green-blue in an alkaline environment. This is easy to notice if you wash the pan with the remains of borscht with soapy (i.e. alkaline) water. Using an acidic solution (vinegar) and an alkaline solution (baking soda, or better yet, washing soda), you can also make inscriptions on petals of various colors in red or blue.
Regular tea is also an indicator. If you drop lemon juice into a glass of strong tea or dissolve a few crystals of citric acid, the tea will immediately become lighter. If you dissolve baking soda in tea, the solution will darken (of course, you should not drink such tea). Tea made from flowers (“hibiscus”) produces much brighter colors.
Probably the oldest acid-base indicator is litmus. As early as 1640, botanists described heliotrope (Heliotropium turnesole), a fragrant plant with dark purple flowers, from which a coloring substance was isolated. This dye, along with violet juice, became widely used by chemists as an indicator, which was red in an acidic environment and blue in an alkaline environment. You can read about this in the works of the famous 17th century physicist and chemist Robert Boyle. Initially, mineral waters were studied with the help of a new indicator, and from about 1670 they began to use it in chemical experiments. “As soon as I add an insignificantly small amount of acid,” the French chemist Pierre Paume wrote about “tournesol” in 1694, “it turns red, so if anyone wants to know whether something contains acid, it can be used.” In 1704, a German scientist M. Valentin called this paint litmus; this word remains in all European languages, except French; in French, litmus is tournesol, which literally means “turning after the sun.” The French also call sunflower; by the way, “heliotrope” means the same thing, only in Greek. It soon turned out that litmus can also be obtained from cheaper raw materials, for example, from certain types of lichens.
Unfortunately, almost all natural indicators have a serious drawback: their decoctions deteriorate quite quickly - they turn sour or mold (alcohol solutions are more stable). Another drawback is that the color change interval is too wide. In this case, it is difficult or impossible to distinguish, for example, a neutral medium from a weakly acidic one or a weakly alkaline from a strongly alkaline one. Therefore, chemical laboratories use synthetic indicators that sharply change their color within fairly narrow pH limits. There are many such indicators known, and each of them has its own area of application. For example, methyl violet changes color from yellow to green in the pH range of 0.13 - 0.5; methyl orange – from red (pH< 3,1) до оранжево-желтой (рН 4); бромтимоловый синий – от желтой (рН < 6,0) до сине-фиолетовой (рН 7,0); фенолфталеин – от бесцветной (рН < 8,2) до малиновой (рН 10); тринитробензол – от бесцветной (pH < 12,2) до оранжевой (рН 14,0).
Laboratories often use universal indicators - a mixture of several individual indicators, selected so that their solution alternately changes color, passing through all the colors of the rainbow when the acidity of the solution changes over a wide pH range (for example, from 1 to 11). Strips of paper are often impregnated with a solution of a universal indicator, which allows one to quickly (albeit with not very high accuracy) determine the pH of the solution being analyzed by comparing the color of the strip soaked in the solution with a reference color scale.
In addition to acid-base indicators, other types of indicators are also used. Thus, redox indicators change their color depending on whether an oxidizing agent or a reducing agent is present in the solution. For example, the oxidized form of diphenylamine is purple, while the reduced form is colorless. Some oxidizing agents themselves can serve as indicators. For example, when analyzing iron(II) compounds during the reaction
10FeSO 4 + 2KMnO 4 + 8H 2 SO 4 ? 5Fe 2 (SO 4) 3 + 2MnSO 4 + K 2 SO 4 + 8H 2 O
the added permanganate solution becomes discolored as long as Fe 2+ ions are present in the solution. As soon as the slightest excess of permanganate appears, the solution turns pink. Based on the amount of permanganate consumed, it is easy to calculate the iron content in the solution. Similarly, in numerous analyzes using the iodometry method, iodine itself serves as an indicator; To increase the sensitivity of the analysis, starch is used, which makes it possible to detect the slightest excess of iodine.
Complexometric indicators are widely used - substances that form colored complex compounds with metal ions (many of which are colorless). An example is eriochrome black T; a solution of this complex organic compound is blue in color, and in the presence of magnesium, calcium and some other ions, complexes are formed that are colored intensely wine-red. The analysis is carried out as follows: a complexing agent, most often Trilon B, which is stronger than the indicator, is added dropwise to a solution containing the analyzed cations and an indicator. As soon as Trilon completely binds all metal cations, a distinct transition from red to blue will occur. Based on the amount of added trilon, it is easy to calculate the content of metal cations in the solution.
Other types of indicators are also known. For example, some substances are adsorbed on the surface of the sediment, changing its color; such indicators are called adsorption indicators. When titrating cloudy or colored solutions, in which it is almost impossible to notice a change in color of conventional acid-base indicators, fluorescent indicators are used. They glow (fluoresce) in different colors depending on the pH of the solution. For example, acridine fluorescence changes from green at pH = 4.5 to blue at pH = 5.5; It is important that the glow of the indicator does not depend on the transparency and intrinsic color of the solution.
Ilya Leenson
INDICATORS(Late Lat. indicator - pointer), chemical. substances that change color, luminescence, or form a precipitate when the concentration of a substance changes. component in the solution. Indicate a certain state of the system or the moment when this state is achieved. There are reversible and irreversible indicators. A change in the color of the former when the state of the system changes (for example, phenolphthalein when the pH of the medium changes) may. repeated many times. Irreversible indicators are subject to irreversible chemistry. transformations, for example, azo compounds during oxidation with BrO 3 ions - are destroyed. Indicators that are introduced into the solution under study are called. internal, in contrast to external, the procedure with which is carried out outside the analyzed mixture. In the latter case, one or more. Drops of the analyzed solution are placed on a piece of paper soaked in an indicator, or they are mixed on a white porcelain plate with a drop of indicator. AND Indicators are most often used to determine the end of a population. chem. districts, ch. arr. end point of titration (t.t.t.). In accordance with titrimetric methods distinguish between acid-base, adsorption, oxidation-reduction. and complexometric. indicators. are p-rime org compounds, which change their color or luminescence depending on the concentration of H + ions (pH of the environment). Appl. to establish the end of the solution between compounds and bases (including during acid-base titration) or other solutions if they involve H + ions, as well as for colorimetric. determining the pH of water solutions. Naib. important acid-base indicators are given in table. 1. The reason for the change in color of indicators is that the addition or donation of protons by its molecules is associated with the replacement of some chromophore groups by others or with the appearance of new chromophore groups. If the indicator has a weak value of HIn, then in the aqueous solution there is an equilibrium: HIn + H 2 O D In - + H 3 O + . If the indicator is a weak base In, then: In + H 2 O D HIn + + OH - . In general form we can write: In a + H 2 O D In b + H 3 O +, where In a and In b - respectively. acidic and basic forms of the indicator, which are colored differently. The equilibrium constant of this process is K ln = / called. indicator constant. The color of the solution depends on the ratio /, which is determined by the pH of the solution.It is believed that the color of one form of the indicator is noticeable if its concentration is 10 times higher than the concentration of the other form, i.e. if the ratio / = /K ln is 0.1 or 10. A change in the color of the indicator is noted in the region pH = pK ln b 1, which is called. indicator transition interval. Change in max. clearly when = and K ln = [H 3 O] +, i.e. at pH = pK ln. The pH value at which titration usually ends is called. titration index pT. Indicators for titration are selected in such a way that the color transition interval includes the pH value that the solution should have at the equivalence point. Often this pH value does not coincide with the pH of the indicator used, which leads to the so-called. indicator error. If an excess of an untitrated weak base or compound remains in the c.t.t., the error is called. resp. basic or acidic.
The sensitivity of the indicator is the concentration (in mol/l) of the ion being determined (in this case, H + or OH -
) at the point of max. abrupt color transition. There are: indicators sensitive to acids with a transition interval in the region of alkaline pH values (for example, phenolphthalein, thymolphthalein); base-sensitive indicators with a transition interval in the acidic region (as in dimethyl yellow, methyl orange, etc.); neutral indicators, the transition interval of which is approx. pH 7 (neutral red, phenol red, etc.). AND Indicators come in one or two colored shapes; such indicators are called resp. single-color and two-color. Naib. a clear change in color would be observed in those indicators whose acidic and basic forms are colored complementary. colors. However, such indicators do not exist. Therefore, by adding dye, the colors of both forms are changed accordingly. Thus, for methyl red, the transition from red to yellow occurs in the range of 2 pH units, and if methylene blue is added to the solution, then the color transition from red-violet to green is observed sharply and clearly at pH 5.3. A similar effect can be achieved if you use a mixture of two indicators, the colors of which complement the other. friend. Such indicators are called mixed (Table 2).

Mixtures of indicators that continuously change their color over the entire pH range from 1 to 14 are called. universal. They are used for approx. assessment of pH of solutions.
The change in color of the indicator is influenced by its concentration. For two-color indicators, the higher the concentration, the less dramatic the color change, because The absorption spectra of both forms overlap each other to a greater extent and the color change becomes more difficult to detect. Usually the same minimum (several drops of solution) quantity of indicator is used.
The transition interval of many indicators depends on the temperature. Thus, methyl orange changes its color at room temperature in the pH range of 3.4-4.4, and at 100 °C in the pH range of 2.5-3.3. This is due to a change in the ionic product of water.
The colloidal particles present in the solution adsorb indicators, which leads to a complete change in its color. To eliminate errors in the presence. positively charged colloidal particles, base indicators should be used, and if present. negatively charged - acid indicators.
When titrating under normal conditions, it is necessary to take into account the influence of dissolved CO 2, especially when using indicators with pK ln > 4 (for example, methyl orange, methyl red, phenolphthalein). Sometimes CO 2 is first removed by boiling or the solution is titrated in the absence of contact with the atmosphere.
The influence of extraneous neutral electrolytes (salt effect) manifests itself in a shift in the equilibrium of indicators. In the case of acid indicators, the transition interval shifts to a more acidic region, and in the case of base indicators, to a more alkaline region.
Depending on the nature of the solvent, the colors of the indicators, their pK ln and sensitivity change. Thus, methyl red in water gives a color transition at higher values of activity of H + ions than bromophenol blue, and in ethylene glycol solution it is the other way around. In water-methanol and water-ethanol solutions, the change compared to the aquatic environment is insignificant. In an alcoholic environment, acid indicators are more sensitive to H + ions than base indicators.
Although when titrating in neutral media the acid-base indicators are usually set potentiometrically using a glass indicator electrode, acid-base indicators are also used (Table 3).
Most often, methyl red in dioxane or crystal violet in anhydrous CH 3 COOH are used for titration of weak bases; when titrating weak drugs - thymol blue in DMF.
The behavior of indicators in non-aqueous and aquatic environments is similar. For example, for the weak value HIn in the solution SH we can write the equilibrium: HIn + SH D In - + SH 2 + . The mechanism of action of indicators is the same as in water, only in non-aqueous media the corresponding acidity scales are used (pH p, pA; see Acid-base titration).
Luminescent indicators are also used as acid-base indicators, changing color and fluorescence intensity depending on pH and allowing the titration of highly colored and turbid solutions.

For titration of weak compounds, the so-called. indicators of turbidity, forming reversible colloidal systems that coagulate in a very narrow pH range (for example, isonitroacetyl-n-aminobenzene produces turbidity at pH 10.7-11.0). Metal complexes with metallochromic indicators (see below) can be used as acid-base indicators; These complexes, when destroyed, change the color of the solution in a narrow pH range.
To determine org. set and bases are present in water. The so-called solvent that does not mix with it is used. amphibious indicators, which are salts of indicator acids (for example, tropeolin 00) with decomp. org. bases (eg alkaloids). These indicators are well soluble. in org. r-ritels, bad in water; are highly sensitive.
Adsorption indicators are substances that can be adsorbed on the surface of the sediment and change the color or intensity of luminescence. These indicators are usually reversible and are used in precipitation titration. First of all, the sediment adsorbs ions identical to those that are part of the sediment itself. sediment, after which the indicator is adsorbed. A large group of indicators are dyes (Table 4), which are adsorbed by the surface of the sediment to form salts with ions contained in the sediment.

For example, a solution of eosin is pink in color, which does not change when AgNO 3 is added. But during titration with KBr solution, the precipitate that falls out adsorbs Ag + ions, which attach eosin anions. The precipitate becomes red-violet. At the c.t.t., when all Ag + ions have been titrated, the color of the precipitate disappears and the solution becomes pink again.
Inorg. adsorbts. indicators form a colored precipitate or complex with titrant ions (such as, for example, CrO 4 ions used as indicators- and SCN - in argentometry).
As an adsorbts. Some indicators are also used: acid-base, oxidation-reduction. and complexometric. indicators, properties of which (acid dissociation constants, oxidation-reduction potentials and stability constants of complexes with metal cations) in the adsorbir. state depend on the nature and concentration of ions on the surface of the sediment.
Oxidation-reduction indicators - substances that can change color depending on oxidation-reduction. solution potential. Used to establish the oxidation-reduction temperature. titration and for colorimetric determination of oxidation-reduction. potential (primarily in biology). Such indicators are, as a rule, substances that themselves undergo oxidation or reduction, and the oxidized (In Ox) and reduced (In Red) forms have different colors.
For reversible oxidation-reduction. indicators can be written: In Oх + ne D In Red, where n is the number of electrons. At potential E, the ratio of concentrations of both forms of the indicator is determined by the Nernst equation:
![]() ,
,
where E ln - real oxidation-reduction. indicator potential, depending on the composition of the solution. The color transition interval is practically observed when the ratio / changes from 0.1 to 10, which at 25 °C corresponds to D E (in V) = E ln b (0.059/n). The potential corresponding to the sharpest color change is equal to Eln. When choosing an indicator, take into account ch. arr. values Eln, coefficient. molar extinction of both forms of the indicator and the potential of the solution at the equivalence point. When titrating with strong oxidizing agents (K 2 Cr 2 O 7, KMnO 4, etc.), indicators with relatively high Eln are used, for example, diphenylamine and its derivatives; when titrating with strong reducing agents [salts Ti(III), V(II), etc.], indicators with relatively low Eln are used, for example, safranin, methylene blue (Table 5).

Some substances change their color irreversibly, for example, during oxidation they are destroyed with the formation of colorless. products such as indigo under the influence of hypochlorites or naphthol blue-black under the influence of BrO 3 ions.
Complexometric indicators are substances that form colored complexes with metal ions (M), differing in color from the indicators themselves. They are used to establish the complexometric indicators in complexometry. The stability of metal complexes with indicators (In) is less than that of the corresponding complexonates,
Therefore, in complexes, complexones displace indicators from complexes with metals. At the moment of color change at the equivalence point = and, therefore, рМ = - log K Mln, where рМ = - log[M] is called. transition point of the indicator, K Mln - stability constant of the metal complex with the indicator. An error during titration is due to the fact that a certain amount
Change in color of indicators depending on pH
Acid-base indicators are compounds whose color changes depending on the acidity of the medium.
For example, litmus is red in an acidic environment, and blue in an alkaline environment. This property can be used to quickly estimate the pH of solutions.
Acid-base indicators are widely used in chemistry. It is known, for example, that many reactions proceed differently in acidic and alkaline environments. By adjusting the pH, you can change the direction of the reaction. Indicators can be used not only for qualitative, but also for quantitative assessment of the acid content in a solution (acid-base titration method).
The use of indicators is not limited to “pure” chemistry. The acidity of the environment must be controlled in many production processes, when assessing the quality of food products, in medicine, etc.
IN table 1 the most “popular” indicators are indicated and their color in neutral, acidic and alkaline media is noted.
Table 1
Methyl orange
Phenolphthalein
In fact, each indicator is characterized by its own pH interval in which the color change occurs (transition interval). The color change occurs due to the transformation of one form of the indicator (molecular) into another (ionic). As the acidity of the medium decreases (with increasing pH), the concentration of the ionic form increases, and the molecular form decreases. Table 2 lists some acid-base indicators and their corresponding transition intervals.
table 2Editor's Choice

